Don’t eat the red snow either!

Do your remember when someone first cautioned you to not eat the yellow snow? Likely referring to how urine will discolor snow in a yellow hue, check out the following publication using snow as a bioindicator of toxic metal pollution near a metal shredder in Winnipeg Ontario.

Solademi, Folarin, and Shirley Thompson. 2020. “Spatial Analysis of Heavy Metal Emissions in Residential, Commercial and Industrial Areas Adjacent to a Scrap Metal Shredder in Winnipeg, Canada.” Journal of Geoscience and Environment Protection 08 (05): 359. https://doi.org/10.4236/gep.2020.85023.


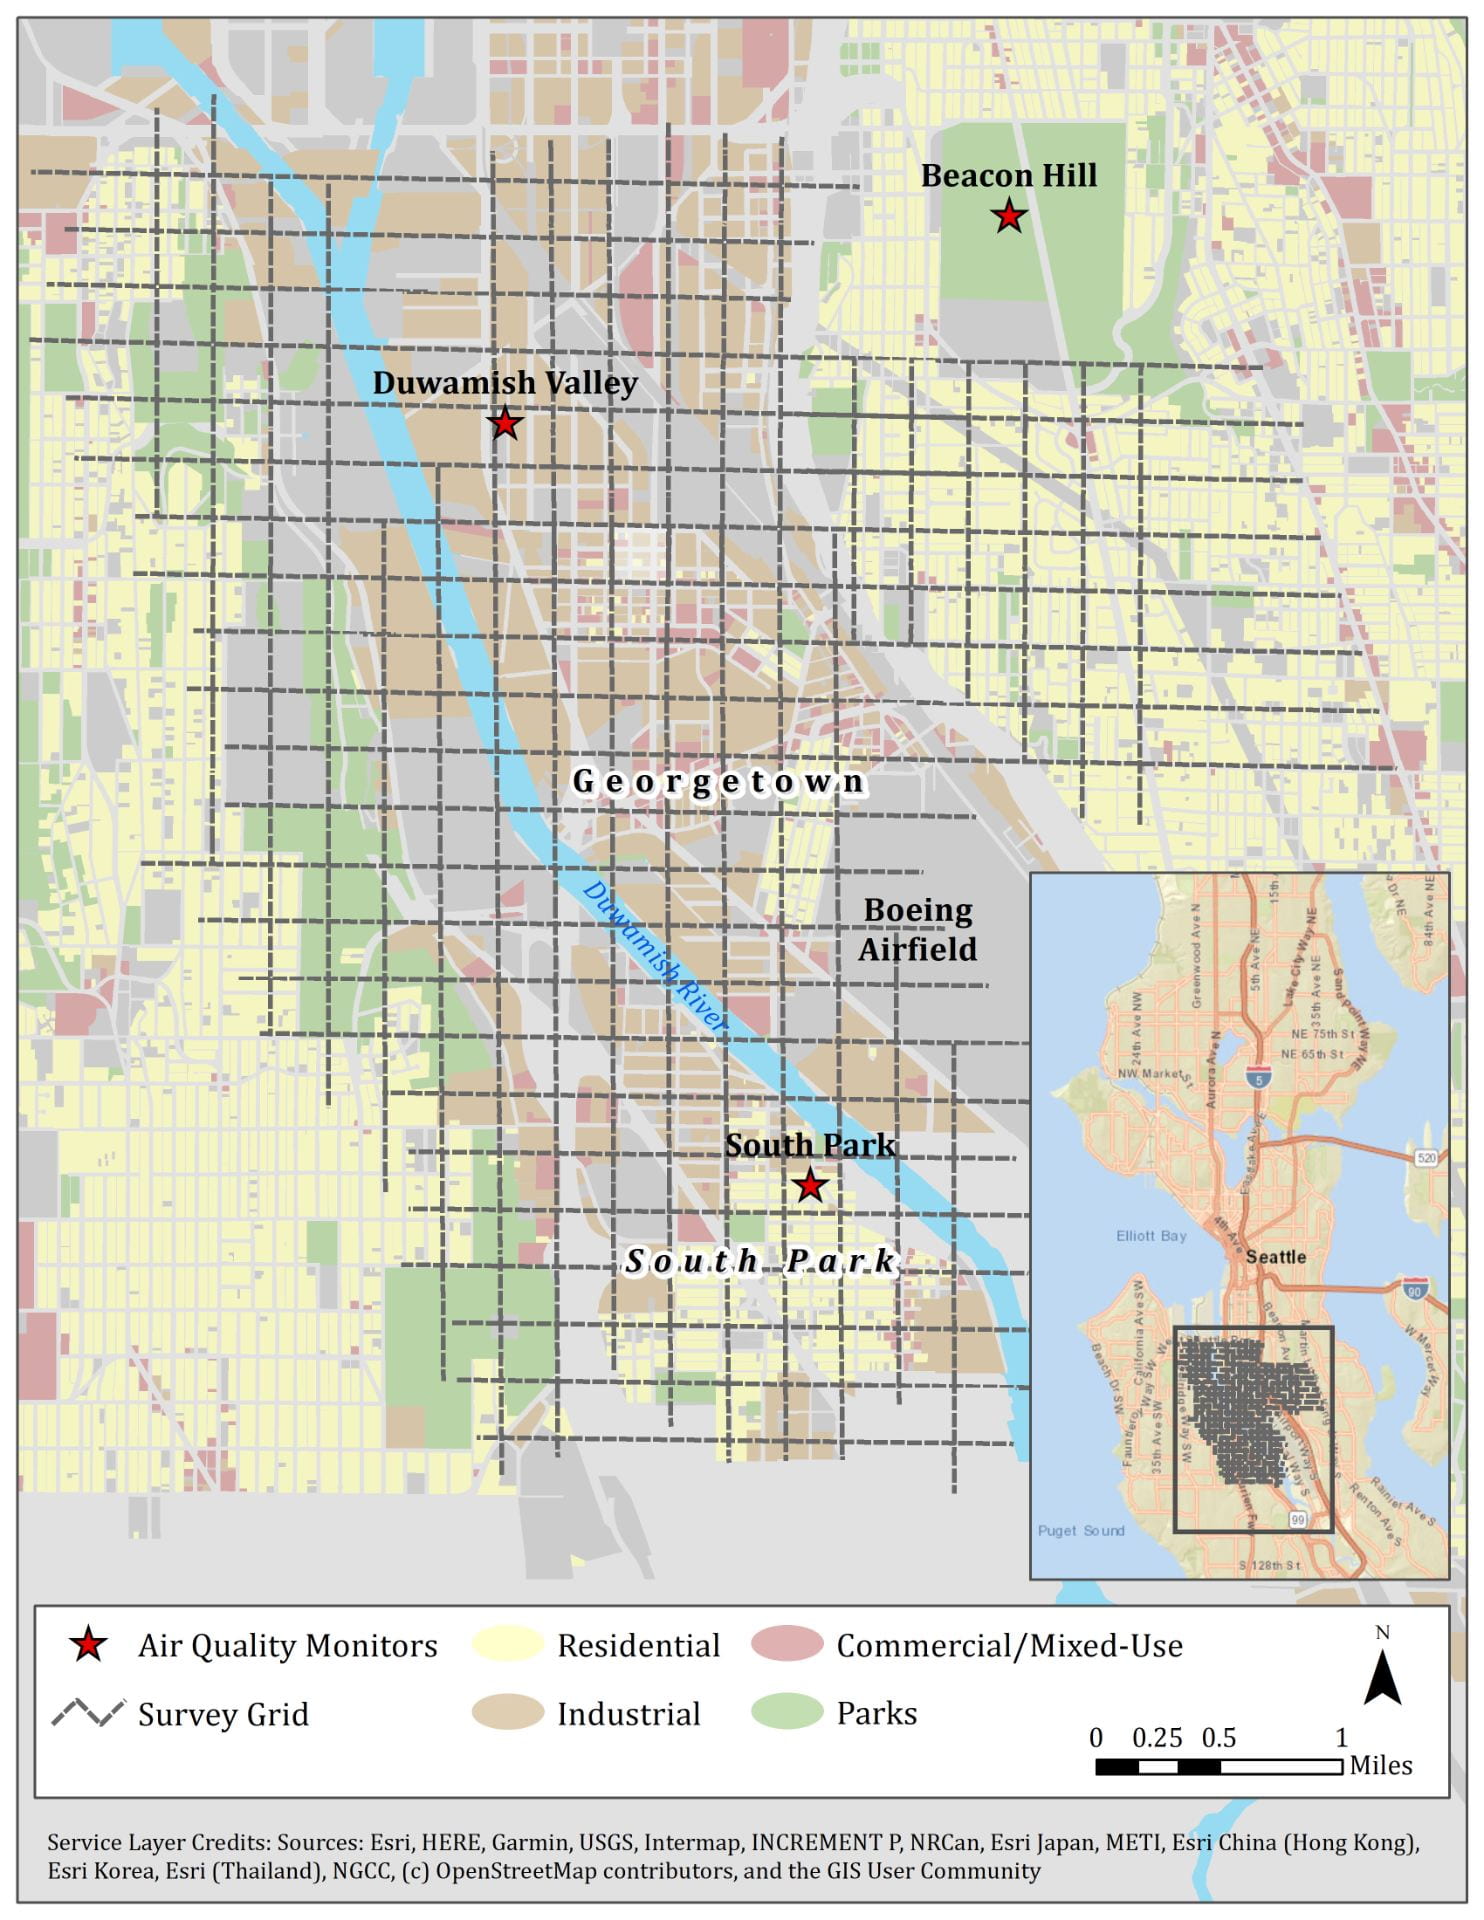
Looks like our heat maps derived from varying lead concentrations in moss suggesting metal shredding and recycling operations are a source of overlooked toxic metal air pollution. 
 
Lead heat map of toxic air pollution in Seattle's Duwamish River Valley.

Lead heat map of toxic air pollution in Seattle’s Duwamish River Valley. Metal shredding and recycling operations were near the epicenter of our two hotspots!

Second win with DRIVERS4EJ Video!

EPA Announces Phase 2 Winners of the Environmental Justice Video Challenge for Students

Honorable Mention ($12,500): DRIVERS4EJ – Western Washington University, University of Washington

Community Organization Partner ($10,000): Duwamish Valley Youth Corps 

Student Team Members ($2,500): Drew Slaney, Jenny Meyer, Rudi Mondragon, Isebella Bergsma, Cianna Bergsma-Galarosa, Christopher Castro, AJ Cooper, Guadalupe Sanchez, Alexis Sorm, Randall Thall, Wala Abdin, Montana Siddle, Nicole Araya, Naythan Ramos, Issaiah Cummins.

Congratulations!

How Can the U.S. Reduce Greenhouse Gas Emissions?

Check out our publication “Can polycentric governance lower industrial greenhouse gas emissions: Evidence from the United States

Abstract for our latest publication in Environmental Policy & Governance. 

The governance challenges embedded in climate change are daunting. Conventional logic holds that national and international action is necessary. While the United States is a major source of Greenhouse Gas (GHG) emissions – second only to China – national action on climate change has been lacking. However, hundreds of subnational US governments and thousands of industrial facilities are actively engaged in addressing climate change. Given the potential mismatch between the global nature of the problem and the policy reach of subnational governments, we evaluate the extent to which polycentric variation in subnational climate action is associated with changes in GHG emissions. We develop a unique data set that incudes facility-level GHG emissions from major industrial sectors in the United States over 8 years and subnational climate governance action across all 50 states. This large-N data set allows us to systematically test hypothesis from polycentric governance. This type of comparative analysis can help to better understand the conditions under which polycentric governance is associated with improved climate change outcomes, that is, declining GHG emissions. Our results suggest that even when controlling for past emissions, some elements of polycentric governance are associated with decreases in GHG emissions. Future research would benefit from augmenting the large N comparative analysis presented here with mixed methods research to more fully understand the dynamic processes shaping both climate policy and GHG emissions.

Dorothy M. DaleyTroy D. AbelMark StephanSaatvika RaiEllen Rogers

WWU Grad students Drew and Allison are #Winners

Two of my environmental studies Master’s students Drew Slaney and Allison Hayes won third place. Their Interdisciplinary Mapping for Environmental Justice documented how we engaged WWU undergraduates in our 2019 moss study. We used this bioindicator to spatially characterize air pollution levels across South Seattle. Then, we helped students combine a table top exercise with EPA’s online EJScreen mapper. See the video below. Congratulations Drew and Allison. Hash tag winners!

Net Zero Failing for Puget Sound Recovery

Last month, we released our natural resource governance assessment for the Puget Sound estuarine ecosystem. Sound Natural Resource Governance for Washington’s Estuarine Recovery? details our assessment. In short, we gave collaborative natural resource governance for the Puget Sound a failing grade. One failure involves a misguided yet multi-decade goal of no net ecological loss. Its analogous to those increasingly popular but flawed net zero carbon pledges. Real progress for both carbon and ecological footprints demands net positive developments.

Unfortunately, habitat degradation continued to outpace restoration all over the Puget Sound. In 2013, Researchers analyzed the 17,700 km2 land area of the Central Puget Sound counties of King, Kitsap, Pierce, and Snohomish. After comparing land cover changes, they estimated that between 1986 – 2007, urban development increased from 8 to 19% of the region. Analysts also found lowland deciduous and mixed forests decreased from 21 to 13% while grass and agriculture decreased from 11 to 8%. This totaled a 22% loss of undeveloped land cover over two decades.

For context, we borrowed David Quamman’s analogy about ecosystem degradation. His book Song of the Dodo about the personalities and history of the theory of island biogeography opens with a 36 Persian rug analogy. Cutting such a tapestry into 36 pieces is what we did to so many ecosystems like the Puget Sound estuary. “An ecosystem is a tapestry of species and relationships. Chop away a section, isolate that section, and there arises the problem of unraveling” according to Quammen.

When you apply this metaphor to land cover and development over time across the Puget Sound watershed, you begin thinking like a biogeographer. Or, visualize the land area of Central Puget Sound as a Salish Blanket composed of 100 panels. Each one would represent approximately 177 km2. With 22% of undeveloped land lost, that’s equal to 22 panels. We therefore shaded 22 panels red in five cuts for this post’s visualization above. 

First, slice four diagonals just inside the upper right corner. Those slashes represent 16% of land cover lost. Now you have five fragments. Imagine another five percent diagonal cut in the upper left of the largest of those five pieces. Now you have six fragments of the original rug after a 21% land cover loss. Now, punch a perforation in the largest piece. This final cut sums with the others to a 22% land cover lost over two decades. Are these six Salish tapestry fragments as valuable as the original one?

Last year, remote-sensed data organized by the Washington Department of Fish and Wildlife (WDFW) was released on the agency’s High Resolution Change Detection (HRCD) hub. The HRCD analysis may contain some good news for the Puget Sound ecosystem. Between 2006 and 2017, 90% of the Puget Sound watershed’s land cover was unchanged. Growth management and other forces slowed development’s advance. But HRCD analysts documented a quarter of a million land cover change events over a decade.

Timber harvest between 2006-2017 represented most of the change. Logging resulted in 266,002 acres cut. That equaled 1,076 km2 or six more of our 100 panels in the visualization above. Yet, in a pilot study of the Nooksack River’s south fork, researchers projected that commercial forestry in the Nooksack basin may reduce summer stream flows in the river. Compared to a no-harvest scenario, summer flows may drop by up to 25%. Clear cuts at high elevations could be promoting faster and significant snowmelt. Younger trees transpire water vapor faster than older trees. Thus, timber harvest may represent more bad than good or even neutral news. Thus, we made six panels yellow.

In more bad news, new impervious and semi-pervious development accounted for 28,322 acres or 114.6 km2 lost. Non-timber harvest canopy removal amounted to another 307.5 km2 of development activity (75,991 acres). In sum, that totals 422.1 km2 of land cover change. Instead of holding to no net loss, just over two panels in the baseline visualization above were lost to development between 2006 and 2017. Which two panels would you shade red?

Finally, there also may be some ugly news for the net ecological gain standard. Since 2007, land restoration acres for the entire Puget Sound equaled 31,059 acres or 125.7 km2 according to the Puget Sound Acquisition and Restoration Dashboard. That’s not even one panel of net ecological gain of our Salish blanket visualization above for Central Puget Sound. Our net zero mindset needs to shift to a net gain commitment. See more from our report here.

Sound Natural Resource Governance for Washington’s Estuarine Recovery?
Risk and EJ Screening for Teaching, Research & Beyond

EPA invited me to describe how I use the agency’s Risk-Screening Environmental Indicators (RSEI) and EJScreen tools in my teaching and research. But I reminded the audience how screening tools are like good research. It should raise more questions than answers. We need to be ready to move beyond risk and EJ screening with ground truthing. Look for more at this EPA website.

https://www.epa.gov/toxics-release-inventory-tri-program/2022-tri-virtual-conference

10th anniversary of winning the Lynton Keith Caldwell Prize

The American Political Science Association’s (APSA) Section on Science, Technology, and Environmental Politics (STEP) awards the Caldwell Prize annually. Our book co-authored with Michael Kraft and Mark Stephan Coming Clean: Information Disclosure and Environmental Performance won in 2012. Almost six decades ago, Indiana University and professor of government Lynton K. Caldwell published and article asking this simple question. “Environment: a new focus for policy?” This 1963 Public Administration Review article planted an important seed.

In 1968, Washington Senator and chair of the Committee on Interior and Insular Affairs, Henry “Scoop” Jackson and the Conservation Foundation’s director Russell E. Train were beginning discussions on what would become the National Environmental Policy Act (NEPA) two years later. The discussion led to, according to Train, the Senate’s hiring of Indiana University’s Lynton Caldwell, a political scientist and leading architect of the Environmental Impact Statement (EIS). He wrote the following. ““Fragmented action and politics affecting natural resources and the human environment have brought waste and confusion in their train and are a result of the lack of recognition of environment as a general subject for public action. . . to change this. . . to obtain integrated planning and action, and to get coordination among the agencies. . . a new policy focus will be required” (Caldwell 1963, 132).

Still proud of our Caldwell Prize win. 

Our 2019 moss study in Ecosphere journal

Heavy metals in moss guide environmental justice investigation: A case study using community science in Seattle, WA, USA

Sarah E. Jovan, Christopher Zuidema, Monika M. Derrien, Amanda L. Bidwell, Weston Brinkley, Robert J. Smith, Dale Blahna, Roseann Barnhill, Linn Gould, Alberto J. Rodríguez, Michael C. Amacher,T roy D. Abel, Paulina López. 2022.

Heavy metal concentrations often vary at small spatial scales not captured by air monitoring networks, with implications for environmental justice in industrial-adjacent communities. Pollutants measured in moss tissues are commonly used as a screening tool to guide use of more expensive resources, like air monitors. Such studies, however, rarely address environmental justice issues or involve the residents and other decision makers expected to utilize results. Here, we piloted a community science approach, engaging over 55 people from nine institutions, to map heavy metals using moss in two industrial-adjacent neighborhoods. . . Future work will address how our approach combining bioindicators and community science ultimately affects success addressing longstanding environmental justice concerns. For now, we illustrate the potential to co-create new knowledge, to help catalyze and strategize next steps, in a complex air quality investigation.

https://esajournals.onlinelibrary.wiley.com/doi/full/10.1002/ecs2.4109

Is this picture worth a thousand words?

I hope this picture helps illuminate environmental education’s justice blind spot. Utilizing the word cloud generator wordart.com, we analyzed the 2019 edition of the North American Association for Environmental Education’s guidelines for excellence publication. Since the word “justice” was only mentioned 10 times compared to 548 environmental appearances, the former displayed in 10-point font while the latter displayed in the largest type. Educate was a distant second with 265 uses followed by student (230 uses), learner (223), and use. 

Interestingly, Community appeared 187 times and Action 163 times. Conversely, equity and race only got 11 and 5 mentions respectively. The term “civic” appeared more with 30 uses and is displayed on the top of the illustration’s tassle. The image is but one way to visualize the larger DEI problem of environmental education’s pedagogy: its typically uniformly, inequitably, and exclusively White.