The Salish Sea Atlas will be on display as part of the opening keynote talk and as part of a hands-on web mapping workshop at this year’s Sound Waters University event on Whidbey Island.
Home
Climate Change in the Salish Sea Webinar Dec 11th 2024
Join us for “Climate Change in the Salish Sea Bioregion: Observed and Projected Trends in Temperature and Precipitation” on Wednesday, Dec. 11 at 4 p.m., Online via Zoom or in person at WWU’s Academic Instructional Center West room 204. This talk is brought to you by Salish Sea Institute at WWU and The Foundation for WWU & Alumni. More info and RSVP for the free talk at https://foundation.wwu.edu/event/climate-change-salish-sea-bioregion

Home
Salish Sea Maps for Week 3 & 4 of 2024’s #30DayMapChallenge
These very low population density census tracts and subdivisions cover 60% of the land area of our bioregion, but are home to only 0.5% of our population.
Day 19’s prompt is “Typography”. Here are the names of large marine water bodies within the Salish Sea oriented and scaled to represent the shape and location of the water bodies themselves.

Day 23’s prompt of “Memory”, I decided to focus on something the land remembers instead of a human memory. Here is the reconstructed extent of the Cordilleran Ice Sheet ~18,700 years ago (based on Dalton et al. 2020).
Home
Salish Sea Maps for Week 2 of 2024’s #30DayMapChallenge

.

Home
Salish Sea Maps for Week 1 of 2024’s #30DayMapChallenge
November is the annual 30daymapchallenge, in which participants challenge to create a new map every day in response to a shared set of daily prompts. I am using this as inspiration to make new maps using data from the Salish Sea Atlas. Here are a few from the first week.
-

- Day 1’s prompt is “points”, so here is a map with points showing the 837 coastal points, capes, etc. with “Point” in their name along the shores of the Salish Sea. Whatever critique you might have, at least you can’t call this map pointless 😁
-

- The prompt for the second day of the 2024 hashtag#30daymapchallenge is lines, which made me think of routes and shipping lanes. This map shows marine vessel traffic counts in the Salish Sea recorded in 2023, using US Coast Guard AIS data from the Marine Cadastre website.
-

- Day 3’s theme is “Polygons”. I made this map showing the how dramatically median age varies across the Salish Sea Bioregion.
-

- For #30daymapchallenge Day 6’s theme of “Raster”, I would like to share this map of the prevalence of Douglas-fir (Pseudotsuga menziesii) in the Salish Sea area. This tree species has immense local cultural and ecological significance, and is certainly one of my favorite trees. This map uses a combination of two MODIS-based tree species classifications (Beaudoin et al. 2014 and Barry et al. 2013) based on imagery from 2000-2009.
-

- I had fun exploring historical cartographic styles for the hashtag#30daymapchallenge Day 7 theme of ‘Vintage”. Here is a visualization of elevation and bathymetry in the Salish Sea Bioregion. I used topobathymetric data from the Salish Sea Atlas (arcg.is/0WaK51 ). I looked at some of my favorite local 18th and 19th century maps for cartographic inspiration and historical toponyms
Home
Climate of the Salish Sea Bioregion Chapter wins award
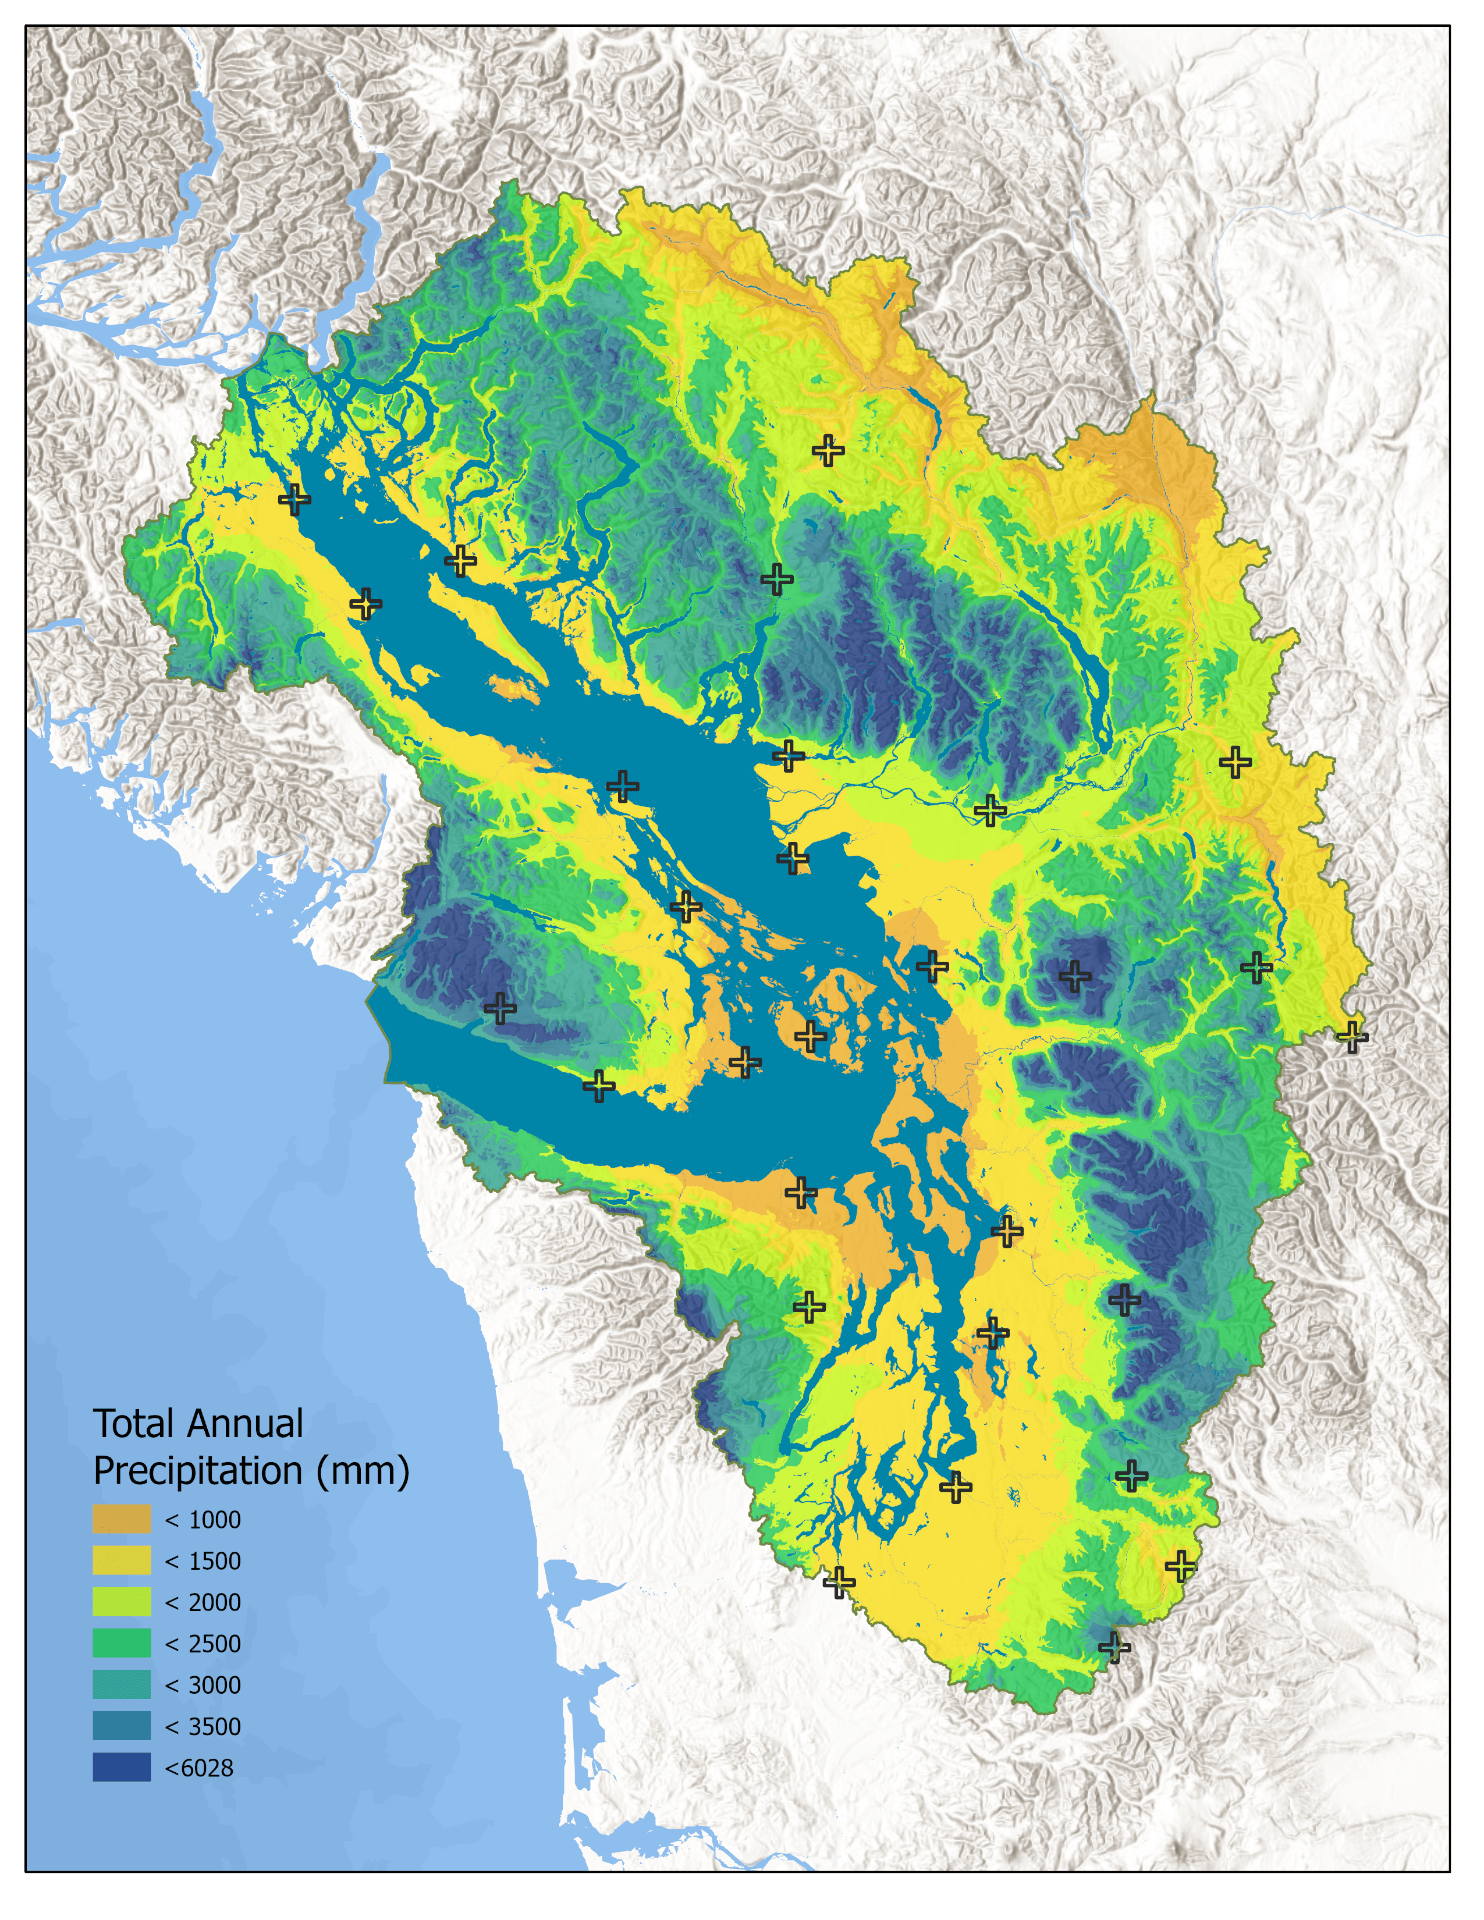
The “Climate of the Salish Sea Bioregion” chapter of the Salish Sea Atlas was selected as one of the best map series at the 2023 ESRI User Conference!
The Salish Sea Bioregion’s diverse topography and hydrology create patterns of local climate that vary impressively across relatively small distances. For example, annual precipitation at high elevations in the Cascade Range or Coast Mountains can be more than 10 times that at low-elevation sites in the rain shadow created by the Olympic Peninsula and Vancouver Island.
Open the Climate chapter to explore the spatial patterns of temperature, precipitation, and wind variables across the Salish Sea Bioregion.
The maps in this chapter use a combination of climate station records and gridded, interpolated climate surfaces with averages calculated for the 1991-2020 period.
Home
Salish Sea Rivers & Surface Currents
Recent discussions around the proposed Roberts Bank Terminal at the mouth of the Fraser River and its potential transboundary effects outside of Canada are a reminder of the significance of the Fraser River for the entire Salish Sea.
This map shows the major rivers of the Salish Sea’s watersheds along with heavily generalized marine surface currents. The Salish Sea is considered an estuarine ecosystem due to the large amount of freshwater that enters the sea each year, and well over half of that freshwater comes from the Fraser River. This freshwater mixes with the marine waters that enter the Salish Sea from the Pacific Ocean to form a brackish surface layer. The brackish surface water currents spread out both north and south from the mouth of the Fraser River, eventually reaching much of the Salish Sea.
Ocean currents do not recognize international borders. Changes to the Fraser River therefore have the potential to alter ecological and oceanographic conditions across the Salish Sea.
You can learn more about the rivers and watersheds of the Salish Sea in the Freshwater chapter of the Salish Sea Atlas.

Map details: the rivers are symbolized by their average annual discharge of freshwater during the 1981-2010 time period, with data from USGS and Environment Canada (full data details and download available here). The Brackish Surface Flow currents are heavily simplified and generalized representations of the annual tidally averaged surface flow based primarily on Khangaonkar et al.’s (2016) analysis of results from the Salish Sea Model. Larger surface current arrows indicate larger volume currents. Download the full-size map here.
Home
Happy Cascadia Day 2023!
Happy Cascadia Day! The Salish Sea Bioregion is nested within the larger Cascadia Bioregion. Cascadia Day is a good day to think about better ways to imagine the regions we humans name, manage, care for, protect, relate to, and love. It’s not hard think up better systems than the arbitrary political boundaries we typically use. Bioregions, with boundaries based on physical landscape features or ecological systems, are often delineated using watersheds. This map shows the Cascadia Bioregion’s location relative to major North American watersheds.

The Cascadia Bioregion in the context of major North American watersheds (Aquila Flower, 2023). Download the full-size image here:Full-size map of Cascadia Bioregion (.png format, 300 dpi)
Home

Home
Salish Sea Atlas presented at the WWU College of the Environment Speaker Series
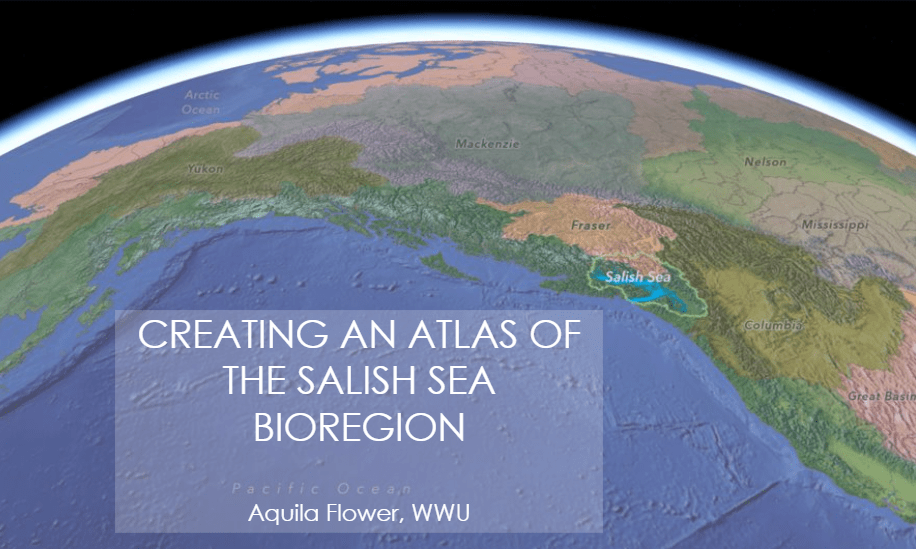
Dr. Flower presented “CREATING AN ATLAS OF THE SALISH SEA BIOREGION” at the Western Washington University College of the Environment Speaker Series on March 9th 2023. Details and a recording of the presentation are available here: https://cenv.wwu.edu/speaker-series/creating-atlas-salish-sea-bioregion